It is becoming a well-accepted fact that the majority of mutual fund managers underperform their respective benchmarks. There is simply too much data on the subject to be ignored. Not less than quarterly Standard & Poors releases a “report card” on the industry and it consistently shows us that the wide majority of funds fail to beat their benchmarks.
Quasi-defenders of active management will note that a great many actively managed mutual funds are “closet indexers.” These funds build portfolios that are so similar to their benchmarks that it is nearly impossible for them to outperform after trading costs and internal expenses. They effectively are the index, just a much more expensive version. To identify these “closet indexers.” a new metric has been developed, called “Active Share.” Active Share is a device used to approximate just how different from a benchmark a fund’s holdings and performance are. If you are trying to pick an actively managed mutual fund (the triumph of hope over experience), a higher active share would be regarded as necessary to give the fund any chance at beating the benchmark.
So how does a manager build a portfolio with high active share? The most common way is concentrated bets. Rather than holding a few hundred stocks like a traditionally diversified closet-indexer, a fund with high active share might only own 30 stocks. This gives each name in the portfolio an opportunity to have a material impact on performance.
The trouble with a concentrated portfolio is that you have to be right. I’d like to pull back the curtain on a few examples of funds that have high active share – funds that act materially different from a traditional benchmark.
Bruce Berkowitz is a legend among fund managers. In 2010 Morningstar named him “Fund Manager of the Decade” after his flagship Fairholme Fund (FAIRX) absolutely demolished the S&P 500 from 2000-2009 by an astonishing 14% per year. Berkowitz is a deep value manager so it is no surprise that he should beat the cap-weighted S&P 500 from the peak of the tech bubble forward. But he also runs a portfolio that pushes the definition of “concentrated” to extremes. According to Morningstar, FAIRX owns ten stocks. That’s 10. One-zero. Ten. The largest holding, AIG, made up 42.8% of the portfolio as of 9/30/14. The next largest position, Bank of America, is 14.4% of the fund. Other concentrated holdings this year include Fannie Mae and Freddie Mac.
This type of concentrated portfolio nearly guarantees that there will be periods wherein the performance departs from that of the benchmark in a big way. In 2011, for example, the S&P 500 gained 2.11% and FAIRX dropped -32.42%. In 2014, Fannie Mae (FNMA), a major holding in the fund, dropped from $3.80 per share at the beginning of September to $1.51 per share in early October, a drop of 60%. Through 10/14/14, FAIRX dropped -9.54% while the S&P 500 gained 3.22%.
Despite 2011 and 2014 performance, the fund has an impressive 10-year track record. Through 9/30/14 FAIRX gained 10.08% per year in the past decade, a good margin head of the 8.11% annualized return of the S&P 500. Unfortunately, Berkowitz’s investors did not fair so well. With big swings in performance come big swings in investor behavior. Due to horrendous timing of investor cash flows, the average investor in FAIRX earned just 5.22% over the same ten year period, barely half of the return of the fund and well less than the S&P 500.
| FAIRX Returns | |||
| Fund Returns | Investor Returns | S&P 500 | |
| 3 Year | 23.63% | 25.14% | 22.99% |
| 5 Year | 11.63% | 7.61% | 15.70% |
| 10 Year | 10.08% | 5.22% | 8.11% |

Let me give you one more example. In 2008 CGM Focus fund was given a Lipper award for best 3-year performance in the Mid Cap Growth category. It’s easy to see why: in 2007, CGM Focus (CGMFX) returned 79.97% (no that is not a typo). In the same year the S&P 500 gained just 5.49%. Again we are talking about an extremely concentrated portfolio: CGMFX today owns 24 stocks and has annual turnover of 291%. Unfortunately for investors, CGM Focus has failed to repeat its outstanding 2007 performance. The fund severely underperformed in the bear market of 2008, falling -48.18%, and lagged in the recovery in 2009 as well. In 2011, the fund fell -26.29% while the S&P 500 gained 2.11%. In 2014 through 10/14, the fund is down -10.32%, lagging the S&P 500 by -13.54%. This is largely due to the fund taking a 30% short position in Treasury bonds, which continue to surprise to the upside.
Again it is the fund’s investors who suffer the most. Over 5 years the fund gained 7.14% (trailing the S&P 500 return of 15.70%) but fund investors only gained 5.49%. (10 year investor returns for CGMFX are currently not available on Morningstar). Investors lost nearly 10% per year for 5 years relative to the S&P 500 in CGMFX.
| CGMFX Returns | |||
| Fund Returns | Investor Returns | S&P 500 | |
| 3 Year | 17.52% | 18.72% | 22.99% |
| 5 Year | 7.14% | 5.49% | 15.70% |
| 10 Year | 7.46% | 8.11% | |
 The issue with high active share is that it, by definition, results in large deviations from market performance. This will happen to the upside and the downside relative to markets. And when managed strategies underperform the benchmark, even for a year, investors head for the hills. They don’t know if this is a temporary setback or if the manager has “lost his touch,” and they aren’t willing to stick around and find out.
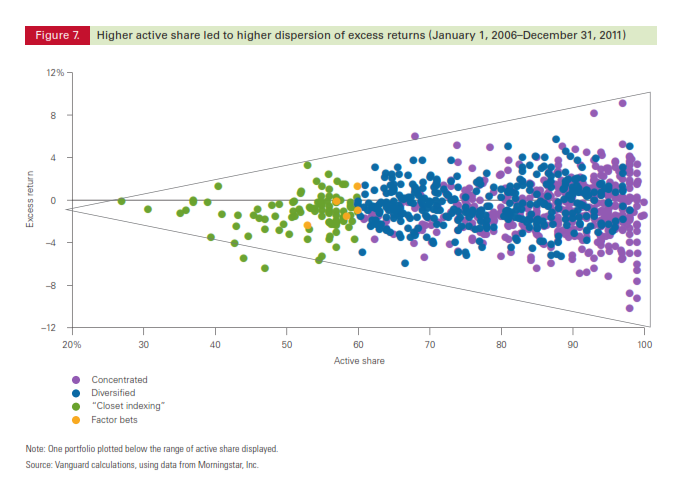
What’s more, high active share is no cure-all. Vanguard did a thorough study on active share and found that:
1) There was no group of high-active share funds that had consistent outperformance,
2) Most highly concentrated portfolios had higher-than-average expenses, and
3)High degrees of active share simply means there will be higher dispersion of returns around the benchmark. Still some will outperform and some will underperform, but the degree to which they do will be larger. See below where more active share leads to a wider dispersion around the average:
In sum, active share isn’t a cure-all. Highly concentrated portfolios lead to big swings in performance, which encourages investors to behave badly, buying into a fund after a stellar run and selling out when the fund’s positions fall from favor. Much like claims of a “stock-picker’s market” when correlations between individual stocks fall, a high degree of active share means a higher probability of the fund having significantly different performance than the benchmark. Whether that performance is well below or well above the benchmark is likely still left to chance.
Continue Reading
