
Market Overview
Markets turned up the excitement in the fourth quarter, especially with respect to US stocks and domestic interest rates. Stocks were sharply higher after the election with small cap stocks leading the way on a truly impressive run. From November 7th through the end of the year, Vanguard’s Small Cap Value ETF gained 15.05%.

Over the same period, the yield on the 10 Year Treasury note jumped from 1.83% to finish the year at 2.45%. Overall 2016 was a great year for investors, particularly in US stocks, and should serve as an excellent reminder of how difficult it can be to predict market outcomes.
Imagine that in January I had told you that early in the year we would see a global stock bear market, that Great Britain would vote to leave the European Union and that Trump would win a poorly predicted US Presidential election. Would you assume that overall volatility would continue to decline, that interest rates would reach new lows and the S&P 500 would finish up just under 12%? In February many market strategists assumed we’d see a bear market in US stocks, and that was even before the Brexit vote. Needless to say, predictions are best left to carnival entertainers and sensible investors should focus on efforts under their own control. Below is a summary of market returns ending at the end of 2016.

Economic Update
One of the longest economic expansion in recent history continues unabated. Real GDP in the US increased again in the third quarter of 2016 with a solid 3.5% year over year change.
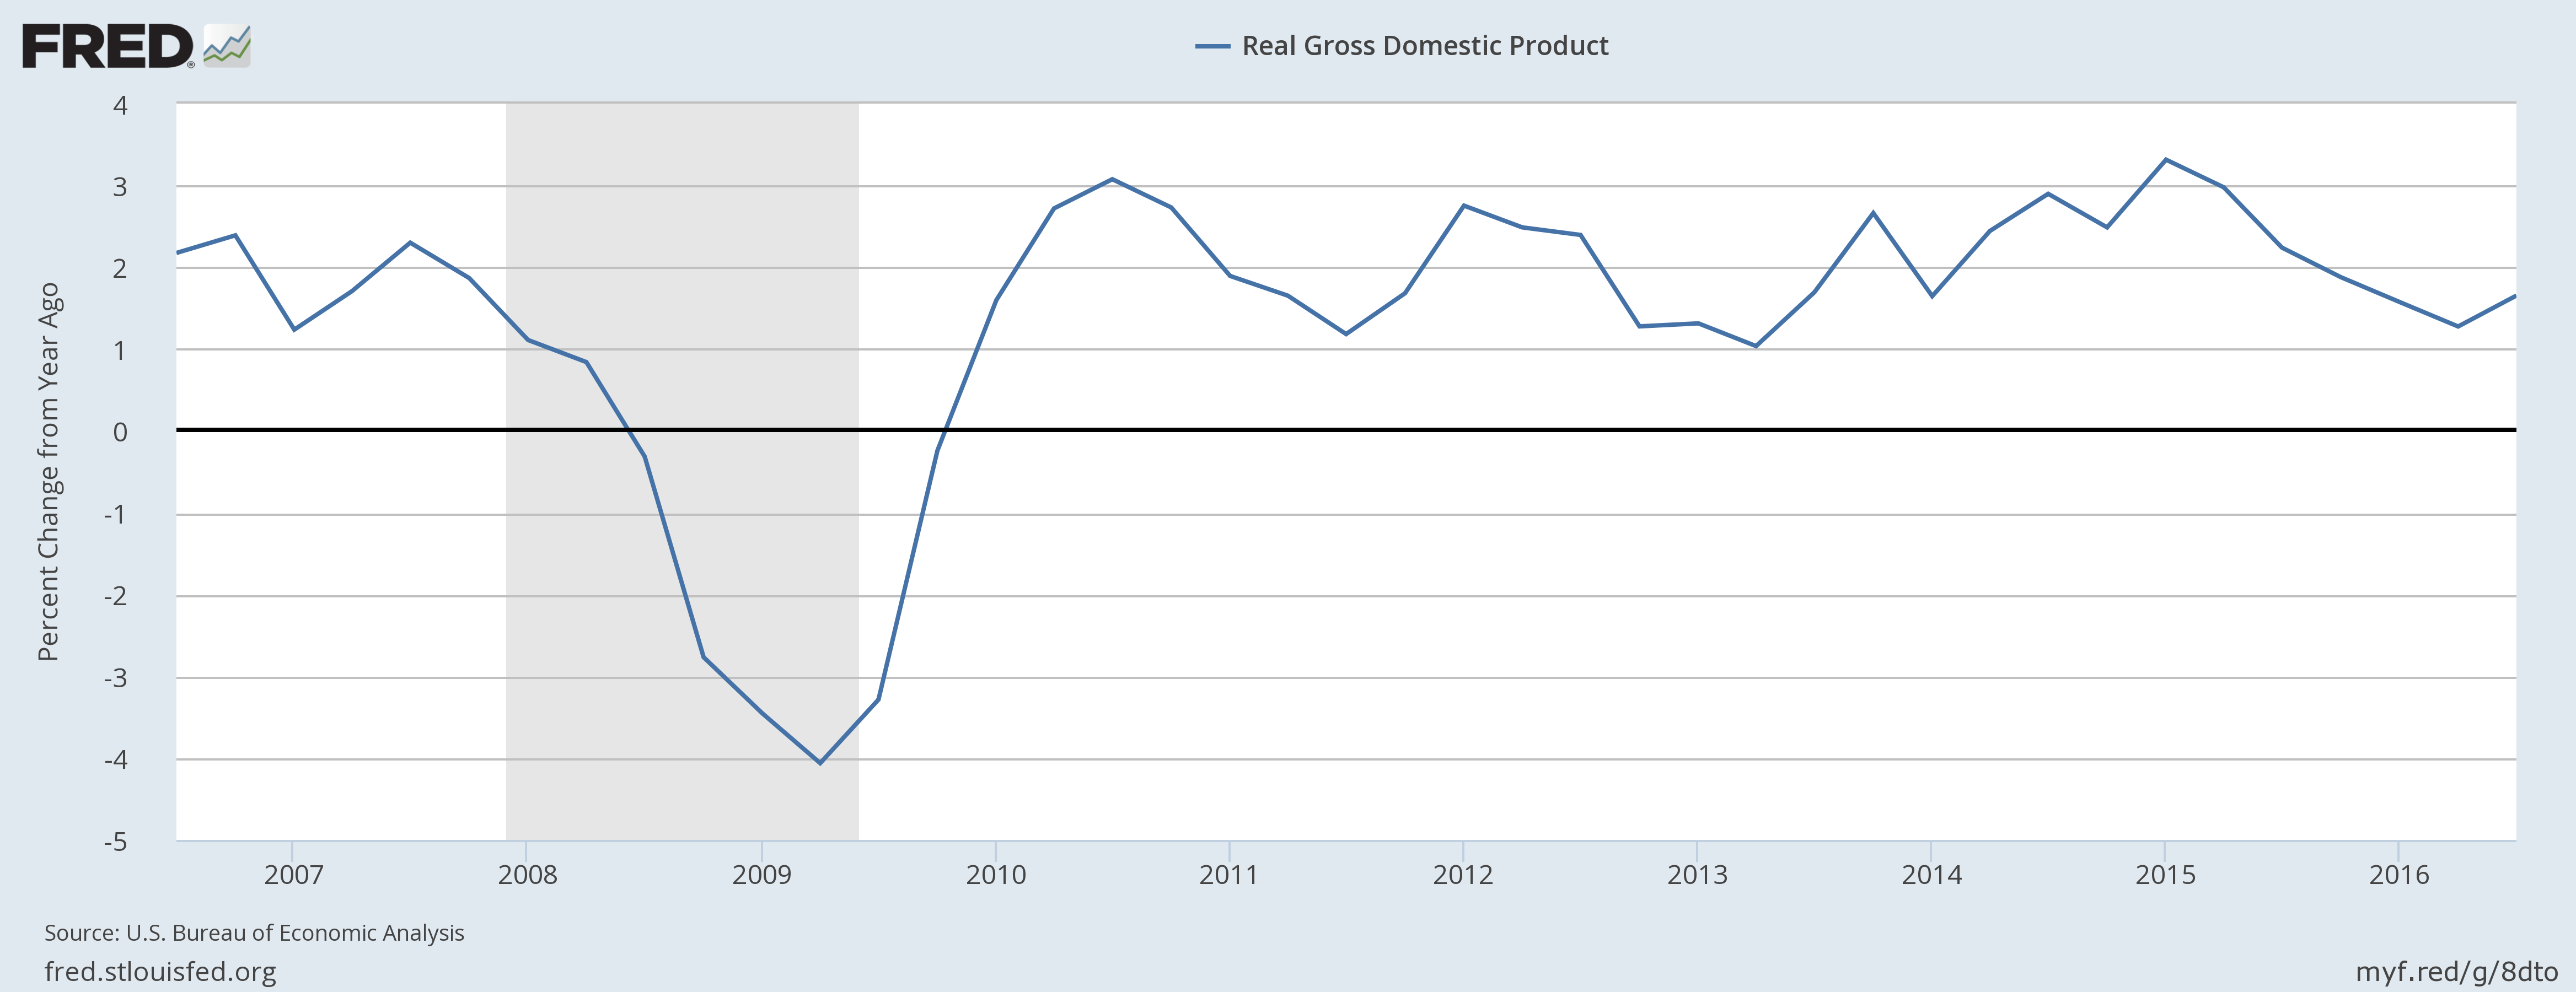
Of course, the strength of the recovery has been muted at best when compared to previous post-recession growth periods. The graph below from JP Morgan shows the cumulative economic growth through and after every recession since 1948, and clearly depicts the shallow nature of this recovery.

Since the recession we have seen lackluster gains in labor productivity, a major driver of GDP growth. Over the past several years, annual percentage gains have been well below previous economic recovery rates.

Another part of the story is that consumers have simply not returned to borrow-and-spend habits we have come to expect. Debt is inexpensive – the cost of servicing household debt has fallen dramatically in the last decade.
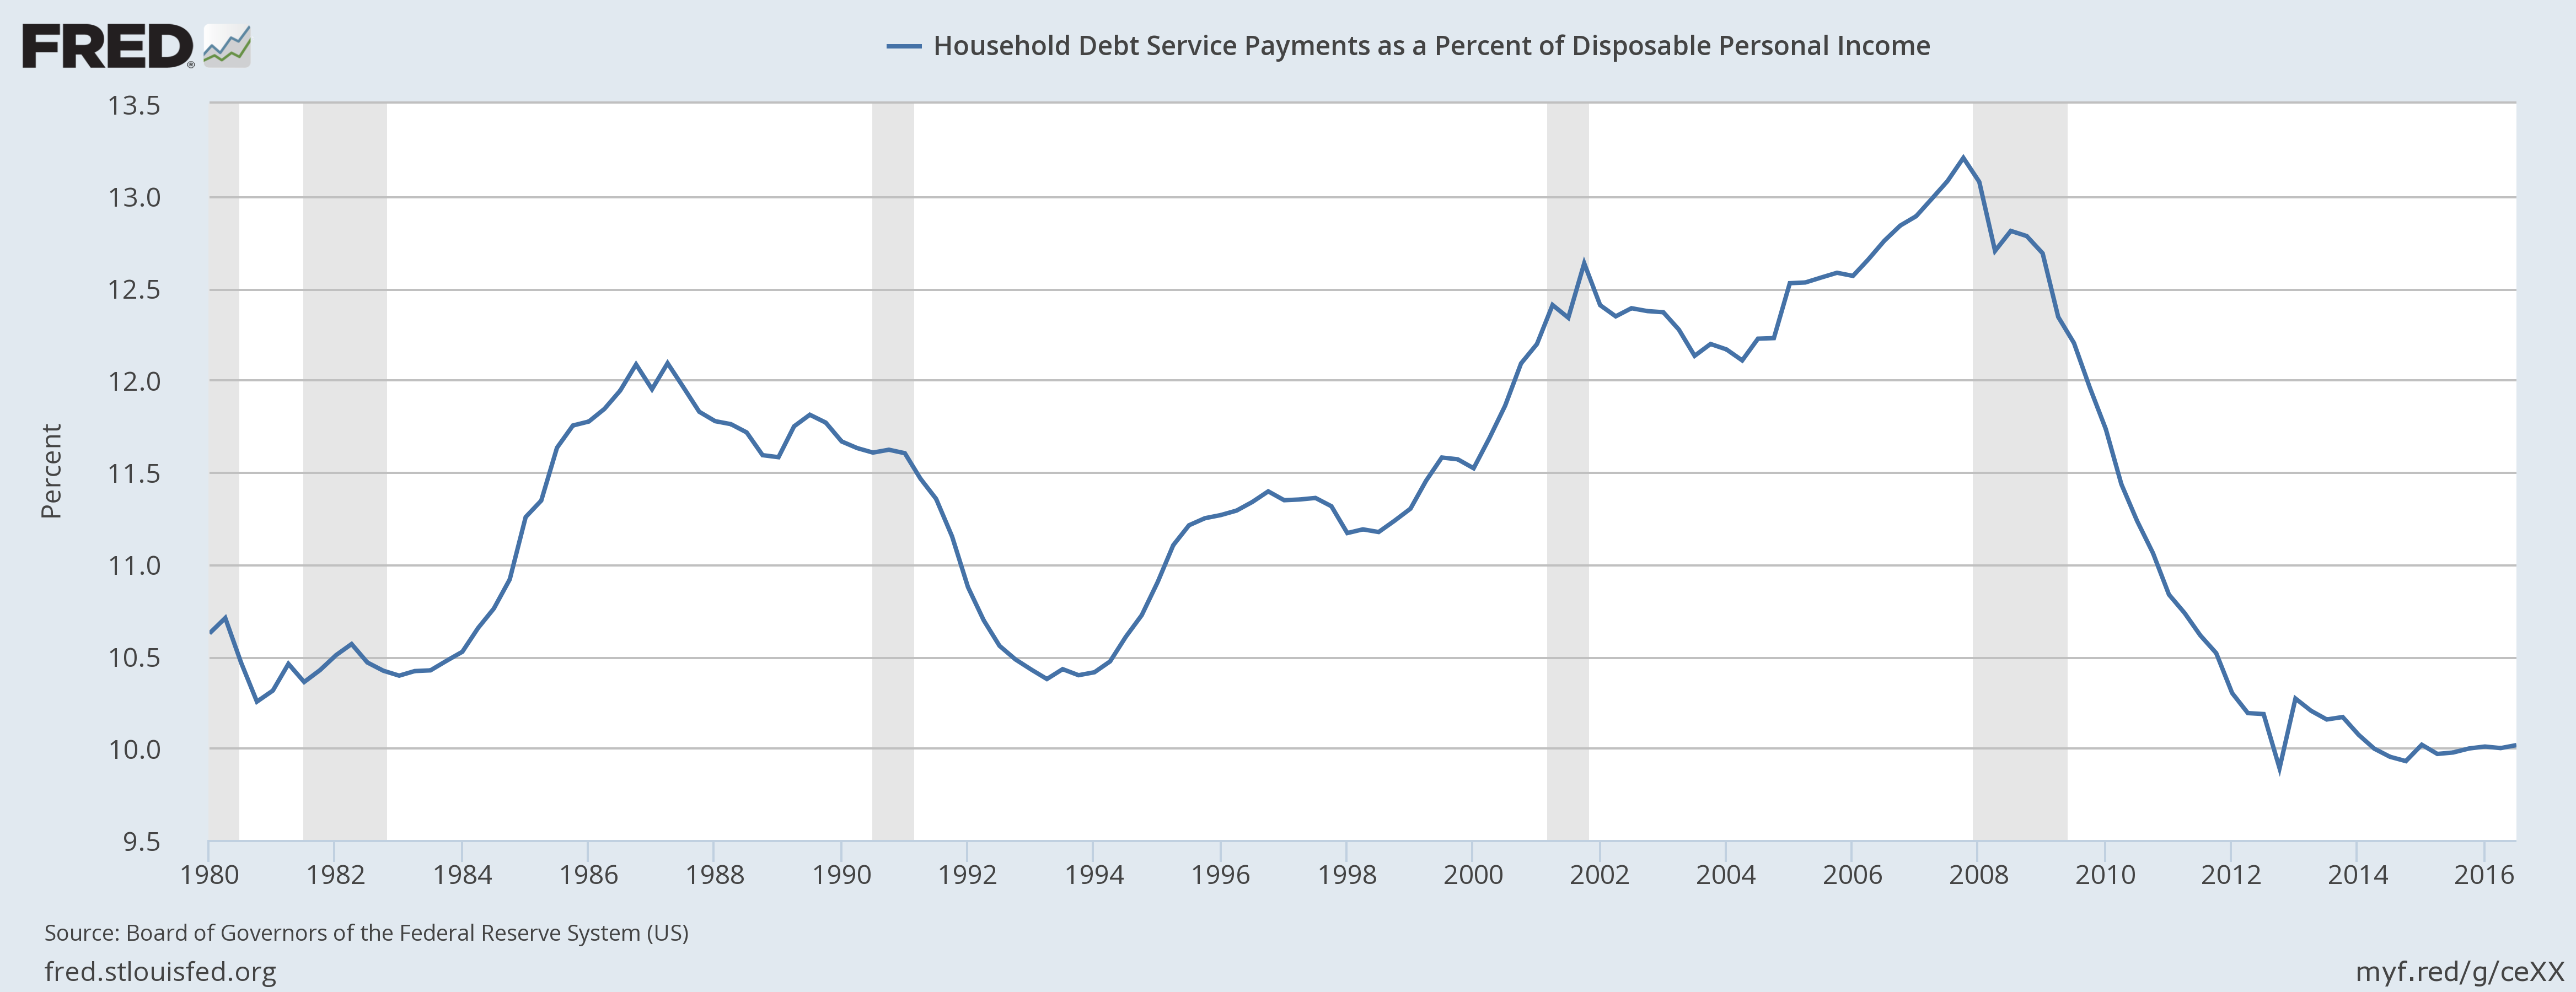
Even still, household debt relative to the US economy has fallen, not risen, throughout the recovery that began in late 2009. As the economy has grown, jobs have been created and consumer confidence has increased, it has not translated into consumer borrowing as shown below.

Despite lackluster consumer activity, the overall recovery has been steady. Unemployment remains low at 4.6% and the labor force participation rate is slowly increasing, despite demographic headwinds. The job market is very healthy for workers, with quit rates staying high and job openings in plentiful supply.


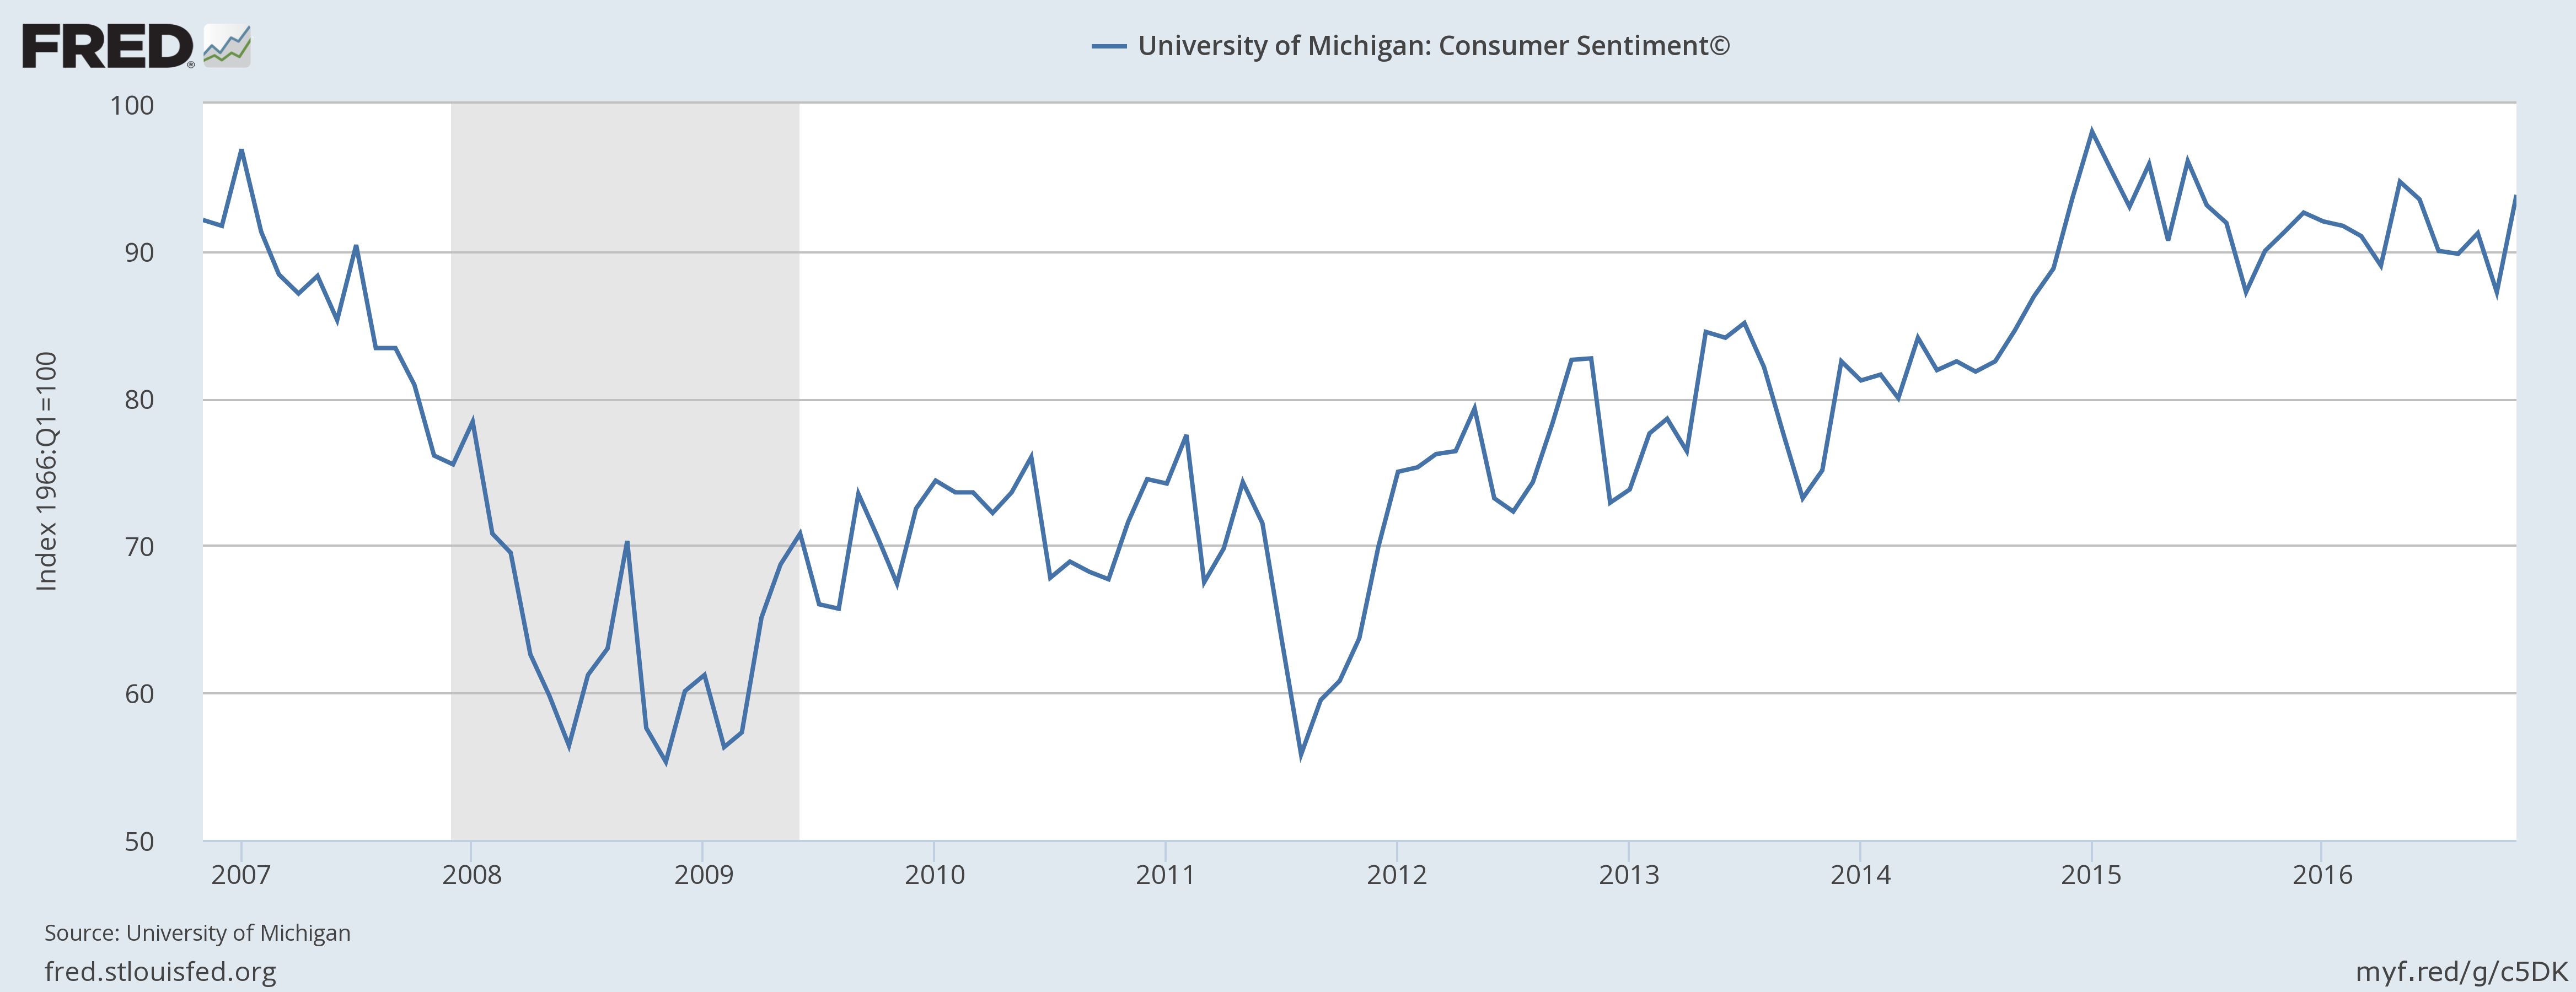
Increasing quit rates are also reflected in consumer confidence, which has been improving throughout the recovery and has been at or above pre-recession levels for most of the last two years.
Housing is a core component of economic growth, and US home prices continue to trend upwards across the country, with recent annual gains of 5.6% through October 2016. This puts home prices at their highest levels since before the recession.

It’s worth pointing out that in spite of broad economic recovery and higher home prices, new construction levels are still muted as excess inventory from the pre-recession period is still worked off. Housing starts continue to increase but are far from historically high levels. This indicates that we seem to be in little danger of another housing bubble.

Tax & Legal Updates
With the elections resulting in GOP control of the House, Oval Office and a slim majority in the Senate, speculation is running rampant about possible tax changes coming as early as 2017. We should recognize that no president has ever been able to perfectly accomplish 100% of campaign promises, irrespective of party control of Congress. Without a 60 vote majority in the Senate, some compromise is to be expected. Some legislation can be changed through reconciliation, but major tax overhaul this way is unlikely. I think it is reasonable to expect we could see the 3.8% Medicare tax on unearned (dividend and interest) income rolled back in 2017. I am also inclined to believe that calls for a massive federal infrastructure spending program will be met with hesitation and skepticism from what has been a very fiscally conservative House.
Below are a few updated figures for 2017 account contribution limits for pertinent retirement and other savings vehicles.
- IRA Contribution: $5,500 ($1,000 catch-up)
- 401(k) Contribution: $18,000 ($6,000 catch-up)
- HSA Contribution: $6,750 (family health coverage, $1,000 catch-up at 55)
- Profit Sharing/Defined Contribution plan maximum: $54,000
- Max compensation limit for SEP, Profit Sharing and DB Plans: $270,000
- Notably, the Social Security wage base increased over 7% from $118,500 to $127,200
As the legislative process unfolds throughout 2017, we will assess any planning opportunities that may arise with pending tax changes. For now, it’s best to wait rather than act on speculation.
As always, you know where to find me if you’d like to discuss any of these topics and how they apply to your personal situation.
