
Market Overview
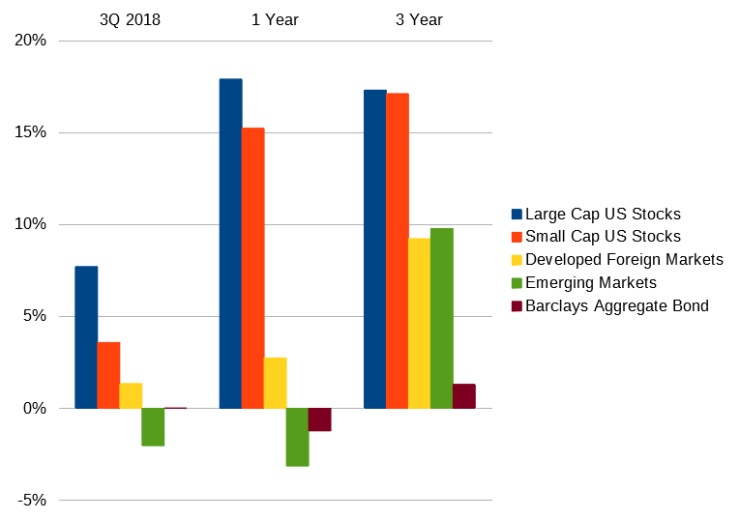
Stock markets were largely positive in the third quarter of this year with (yet again) large-cap US stocks leading the charge with very strong gains, up 7.71% in the last 3 months. Small cap stocks held their own with positive returns and international markets gained, with MSCI EAFE up 1.35% for the quarter. Most high quality bonds were flat, with the Barclay’s Aggregate up 0.02% and municipals down 0.15% as the markets responded to ongoing Fed rate hikes and inflation expectations grow.
I could nearly verbatim leave the commentary from last quarter up again for this quarter. Solid markets, led by US large cap stocks, have been the story once again. Rising rates have put some modest pressure on bond returns but the slaughter so many have been predicting in the bond market is no where to be found. Instead, investors are seeing minor price pressures and increasing yields on most shorter and intermediate term high quality bonds, which is where most investors should be looking for their bond exposure.
Being diversified continues to come with its own pain. While investors with concentrated portfolios of large cap US stocks have outperformed the global markets, we have to recognize that this has not always been and will not always be so. Both in the recent past and in an assured future there will be times where US stocks lag other parts and pieces of a diversified portfolio, be it the bond market, international stocks or real estate investments. The hardest part, as always, is being in the thick of it. It’s hard to be a successful investor, period. It’s hard when markets are good but there are parts of your portfolio you wish you didn’t own. It’s hard when markets have been good for many years and you are worried about the next shoe to drop. It’s hard when inflation is ticking higher and bond markets feel pressured and you see a drag on your returns. It’s hard when markets are shaky and the news convinces you that this is the big one. And it’s hard when it is the big one, when you see years and years of hard-earned savings “disappear” from your balance sheet. If it were easy, everyone would succeed. If it were easy, there wouldn’t be a premium return to stocks. If it were easy, we wouldn’t see massive gaps between the available returns of stock markets and the actual returns earned by investors. But it isn’t easy, and that’s important to recognize.
Economic Update
Economic growth has continued on the same trend that we have seen for the better part of a decade now. Real Gross Domestic Product jumped significantly in the second quarter (the most recent report) at 4.2% annualized. This represents a material increase from the previous quarter, and we’ll see how sustainable a high rate may be.
Digging into the data, the overall picture is strong. Inflation remains in check but has steadily ticked upwards over the last few years as we see some pressure on wage growth. The most recent 12-month change in CPI through August was 2.7%.

This has led the Federal Open Market Committee to again very recently raise the Fed Funds target rate, now up to 2-2.25%, up another 0.25%. This has trickled through to savings and money market accounts, now offering something like an actual interest payment to savers.

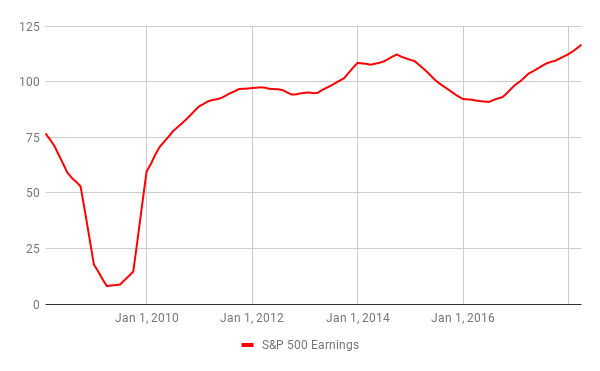
While there has been much hand-wringing about stocks “getting ahead of themselves,” it’s important to recognize that corporate profits have grown alongside stock prices since the market bottom.
We should also pay attention to how much cash has been returned to shareholders both via traditionally historical mechanisms like stock dividends and more recently important stock buybacks, which effectively function as one-time dividends to shareholders.

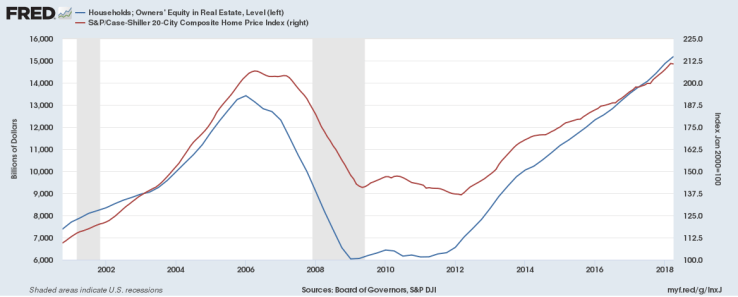
Outside of corporate America, the average American household remains in great financial shape, especially compared to the last 20 years. Despite large gains in home prices, Americans have not returned to past habits of cashing out that equity for personal spending, and growth in the value of home equity has recently outpaced the growth in actual home prices.
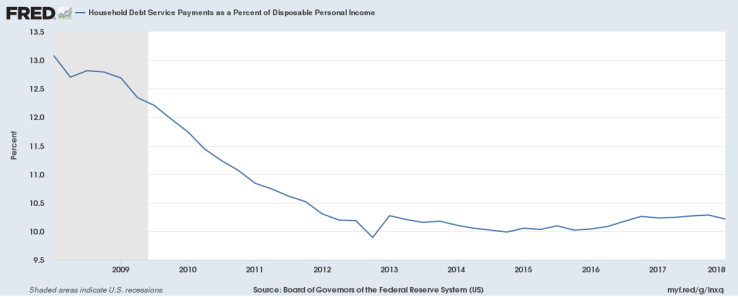
And again, one of my favorite charts is below. American household debt is as affordable as it has been for nearly any historical period. Although incomes have not grown as quickly as equity markets, we can at least appreciate that household cash flow is not squeezed by debt obligations as it had become prior to the financial crisis.
Tax & Legislative Updates
The economic story out of Washington is still the same: trade. Since President Trump imposed tariffs on steel and aluminum on most of the world in the first quarter, we’ve seen an expansion in US tariffs and widespread retaliatory policies across the world. These first steel and aluminum tariffs include longstanding economic partners including Mexico, Canada and the EU.
In July, President Trump extended an additional 25% tariff on 800 categories of goods from China, valued at roughly $50 billion USD. A back-and-forth ensued, most recently in September with a new 10% US tariff on another $200 billion of Chinese goods, a rate slated to increase to 25% by year-end. As could easily be expected, China retaliated with a new set of 5-10% tariffs on 5,000 US goods. This included reduced tariffs on many of China’s other trading partners, making US imports thereby less attractive to Chinese consumers.
The impact of all of these traded blows was predictable. Growth in global trading volumes began to slow earlier this year, with a drop hitting this summer.

Ultimately US consumers will pay the higher price for most manufactured goods, whether they are imported and subject to tariffs or made domestically at higher costs. The broad impacts of a trade war have yet to be fully realized, and time will show us the total effects on the US and global economy.
