Market Overview
The second quarter in the markets this year has been strangely, wonderfully quiet. And as a result, we saw solid gains from many asset classes and most of us didn’t notice. Remember the banking crisis from just a few months ago? Gone, poof, in a whisper. This, of course, is what markets do. They scare us, then those scares die off and we get back to normal business operations while no one is looking.
And so quietly, while everyone was still a little unsettled, we had ourselves a very nice quarter. US large cap stocks led the way, and we saw modest gains in international and small caps. Bonds were slightly negative for the quarter and over the last twelve months.

| 2Q 2023 | 1 Year | 3 Year | 5 Year | |
| Large Cap US Stocks | 8.74% | 19.59% | 14.60% | 12.31% |
| Small Cap US Stocks | 2.90% | 7.83% | 13.50% | 3.64% |
| International Equity | 2.95% | 18.77% | 8.93% | 4.39% |
| EM Equity | 0.90% | 1.75% | 2.32% | 0.93% |
| Aggregate Bonds | -0.56% | -0.37% | -3.44% | 0.95% |
Index performance is provided as a benchmark. It is not illustrative of any particular investment. An investment cannot be made in an index. Past performance is not an indication of future of results. S&P 500, S&P 600, MSCI EAFE Index, MSCI EM Index, S&P US Agg Bond Index. Returns as of 6/30/23.
Economic Update
Are we going to get our much-hyped “soft landing?” At the moment, at least, it seems like much of the data is pointing that way. A confluence of events, largely driven by interest rate changes has taken some of the red-hot heat off of the economy.
The Federal Reserve continues to signal that it is nearly (completely?) done raising the short-term target Fed Funds rate. We’ve gotten a short respite from the upward trend and the current target sits at 5-5.25%.

Of course, the Fed Funds target rate is the Federal Reserve’s primary mechanism for trying to influence the rate of economic activity – higher rates = lower activity (in theory, at least) and vice versa. The rate increases that we saw from early 2022 through early 2023 were an attempt to slow down the rate of money through the economy and get a grip on rising inflation. It appears to have been quite effective. Inflation peaked in mid 2022 and has been trending downward since.

Long-term interest rates closely track inflation expectations as lenders expect to get SOME sort of real return on their money. As inflation expectations continue to fall, we’ve seen some steadying of long term rates including 30 year mortgage rate averages.

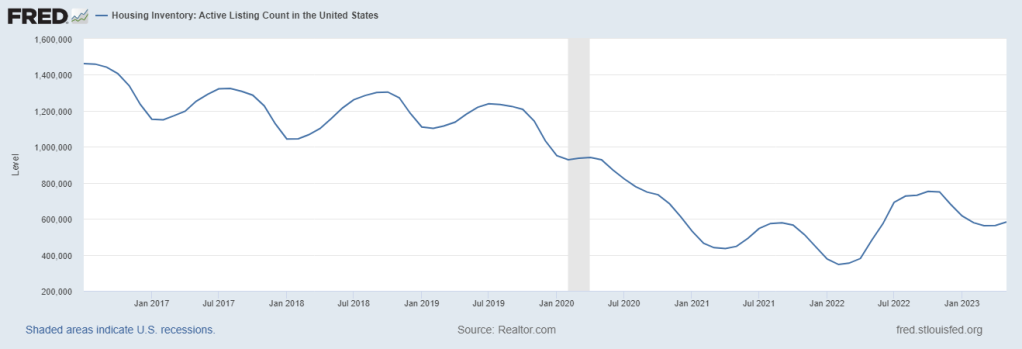
Higher interest rates have also rippled through to the housing market. Prices have softened a bit, but we’ve mostly seen a large slow down in general activity. Fewer sellers are willing to let go of generational-low mortgage rates and inventory is once again very low. New listings last week were down 29% from the same time a year ago, and pending home sales per the National Association of Realtors were down 22.2%. Case-Shiller reported that national home prices fell 0.2% year-over-year in April.

What does this mean for the labor market and the economy at large? While the job market remains tight, the broad labor shortage is not quite as bad as we have seen in recent years. Job openings (unfilled, of course) have fallen some and initial unemployment claims have ticked up a bit in the last few months.


Lastly, GDP growth has been steady and unexciting. The most recent revision to first quarter estimates put real economic growth at 2.0% for January-March 2023. This is positive but down slightly from 2.6% in the fourth quarter 2022.

As for tax and policy updates: I have very little. This Friday, June 30th, the Supreme Court ruled against President Biden’s student loan forgiveness policy. For the moment, that idea is dead in the water. Outside of that, there’s no new legislation or rumor of legislation that affects individuals’ personal finances at this time.
