
If the last quarter of 2018 was scary, the first quarter of 2019 has been quietly wonderful, and most people haven’t noticed. Stocks across the board have posted double digit gains, from US large (13.65%) and small caps (14.58%), growth to value, even international stocks (9.98%) and emerging markets (9.56%) gained in the high single digits. US REITs continued their incredible push, up 16.38% so far this year already.
Bond investors are starting to see the benefits of pushing through some headwinds while rates were rising in the last few years. Yields have lifted off of near-zero levels as the Barclay’s Aggregate Index gained 2.94% led by especially strong corporate bond returns (5.14%).

And somehow amidst all of this, crickets. No one is seemingly excited about the S&P gaining 13.65% this year, especially not compared with how nervous people were about a drop of -13.58% in the fourth quarter of 2018. I suppose I should not be surprised – this is everything that behavioral finance research teaches us. We’re loss averse and more easily scared than excited (not that excited is often a good thing in markets!). The real lesson from the last six months is for us to recognize how perfectly normal the last six months have been. Markets go down, then back up. Repeat. Eventually, they go up more than they go down. Companies grow profit, innovate, productivity grows and investors are rewarded for the risks they bear. This is what works in the long run. In the short run, anything goes, and often does. There’s no reason to get worked up about each decline or overly enthusiastic about each run up. We need perspective, and that comes from paying attention, recognizing just how frequently these patterns repeat.
Economic Update
Broad economic signals remain positive, although some signs of slowed growth are apparent.
First quarter Gross Domestic Product was revised downward to 2.2% last month. This was a slight drop from the 3.4% real GDP growth in the third quarter of 2018. Current consensus estimates for 1Q 2019 GDP are in the 1.0-1.5% range (NY Fed 1.3%, Atlanta Fed 1.2%). This is the biggest indication of expected slowing economic growth.

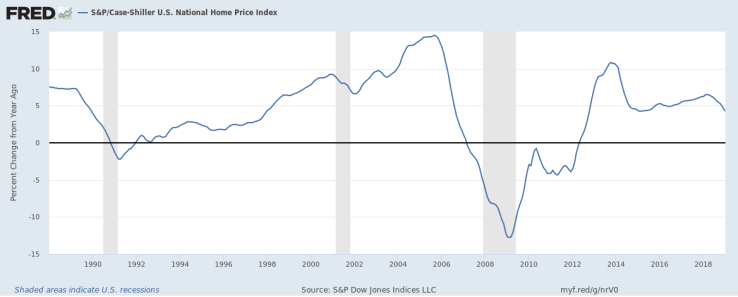
Housing news has been mixed. National home prices continue to increase, as the Case Shiller National Home Price Index gained 4.3% year over year. Changes in home prices have been positive for every 12 months period since 2013.
New home construction has flatted, with new units coming online but the rate of growth has leveled off. We are still well below the rate of new construction seen in the US before the Great Recession, a possible sign that there remains excess inventory and that the Millennial generation has yet to fully come online as new homebuyers.

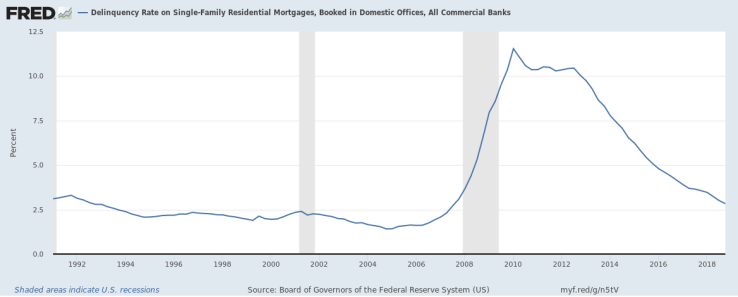
Mortgage delinquencies are down, a sign of strong employment, confidence and steady income for US consumers. Freddie Mac’s “Serious Delinquencies” were down in February to 0.69% from 0.70% the previous month. The rate peaked at 4.20% in 2010. The US Federal Reserve data mimics this decline, as below.
After ticking up in 2018, mortgage rates have fallen again, helping new home buyers find more affordability and keeping defaults low. Current national average rates are hovering just over 4%, fairly low by recent measures and historically much closer to all-time lows than average!

In light of some softening economic data, the Federal Open Market Committee most recently decided to hold rates steady in the 2.25% – 2.50% range, and stressed “patience” at the March 20th meeting, indicating no more rate hikes may be on the table for 2019.

In labor markets, we have gone nearly a year with more reported job openings than active job seekers. Thus the continued trend of a very strong labor market remains in place. Most recently, openings have far outpaced hires (as well as quits) which indicates employers may be finding it harder and harder to acquire and retain staff.

Tax, Legal & Legislative Updates
The longest Federal government shutdown ended in January after congress and the President failed to agree on a budget in late December and the government was without funding. On January 25th a stopgap bill was passed without funding $5.7B for a border wall as the President had previously demanded, but only until February 15th. On February 15th the President signed a longer term budget bill, again without the requested amount for the border wall, and at the same time declared a national emergency to circumvent the need for congressional approval for this spending.
It is likely that the shutdown will have a material impact on Q1 economic growth, with estimates from the White House Council of Economic Advisors showing a cost of 0.5% of lost GDP growth.
Despite widespread agreement among politicians and economists on the negative impact of trade barriers and the apparent failure of the President’s tariff policy so far, President Trump is now considering a new tariff of up to 25% on the import of foreign autos into the United States. The US trade deficit with China alone grew to $419 billion in 2018, a new record over the previous level of $375 billion in 2017. Global trade tensions remain high and the WTO projects that the first quarter of 2019 will again show below trend growth in global trade activity. Ultimately reduced worldwide economic activity cannot benefit US global economic growth.
